


Blog
WordPress Debug Mode: Complete Troubleshooting Guide


Table of Contents
Understanding WordPress Debug Mode
WordPress debug mode is a built-in tool that helps developers uncover PHP errors, warnings, and notices during site development. Acting as the master debugging switch, it reveals issues that might otherwise stay hidden. When activating WordPress debug mode via wp-config.php, three core constants control how errors are handled.
WP_DEBUG (the master switch), WP_DEBUG_LOG (logs errors to wp-content/debug.log), and WP_DEBUG_DISPLAY (shows errors on screen). According to WordPress.org, set WP_DEBUG and WP_DEBUG_DISPLAY to true only on staging sites; on a live site, keep WP_DEBUG_DISPLAY false while using WP_DEBUG_LOG to capture errors silently. Leaving error display exposed on production can compromise security and user experience.
Understanding these errors is the first step toward a healthier, faster website—a prerequisite for effective local SEO. In our SEO software FAQ, we emphasize that error-free code is a critical factor when choosing SEO tools. If sorting through debug logs feels overwhelming, our WordPress plugin support team can help maintain a clean, error-free environment, supporting your AI-driven local SEO efforts.
Preparing Your Site for Debugging
Before diving into on-page optimizations, you must ensure your site can report errors effectively. Enabling wordpress debug mode is the first critical step.
WordPress stores its core configuration in the wp-config.php file. To begin logging errors, add these constants:
define('WP_DEBUG', true);– Activates debug mode in WordPress.define('WP_DEBUG_LOG', true);– Writes PHP errors and warnings to/wp-content/debug.log.define('WP_DEBUG_DISPLAY', false);– Prevents error messages from showing on your live site.
On production sites, always set WP_DEBUG_DISPLAY to false—this avoids exposing sensitive path or database details to visitors. For high-traffic or multisite installations, we recommend pairing WP_DEBUG_LOG with an error monitoring plugin that can send alerts and aggregate logs into a searchable interface.
Activating wordpress debug mode writes errors to a log file you can review. Regularly checking that log or using automated monitoring helps you catch issues before they affect user experience or search visibility.
As our internal FAQ highlights, a branded white-label dashboard builds client trust. Leveraging the best SEO software can automate error tracking and present results in a branded dashboard your clients will trust, integrating debugging insights directly into transparent reports. This approach retains clients with no contract or commitment.
Once your logs are properly configured, you can begin diagnosing issues; the next section will cover interpreting debug.log entries.
Enabling Debug Mode via wp-config.php
Understanding how to enable WordPress debug mode is essential for any site owner who wants to catch PHP errors before they affect visitors. The configuration happens inside the site’s central configuration file, wp-config.php.
- To activate debug mode in WordPress, access your site’s files via FTP or your hosting control panel’s file manager and open
wp-config.php. - Locate the line that says
/* That’s all, stop editing! Happy publishing. */and insert the following constants just before it:
define('WP_DEBUG', true);
define('WP_DEBUG_LOG', true);
define('WP_DEBUG_DISPLAY', false);WP_DEBUGturns on the global debug mode,WP_DEBUG_LOGsaves errors to/wp-content/debug.log, andWP_DEBUG_DISPLAYset tofalseprevents errors from showing on your live pages—a crucial security measure.- Save the file and test for issues. However, as the official WordPress documentation stresses, never leave debug mode enabled on a production site; it can leak sensitive data and degrade performance.
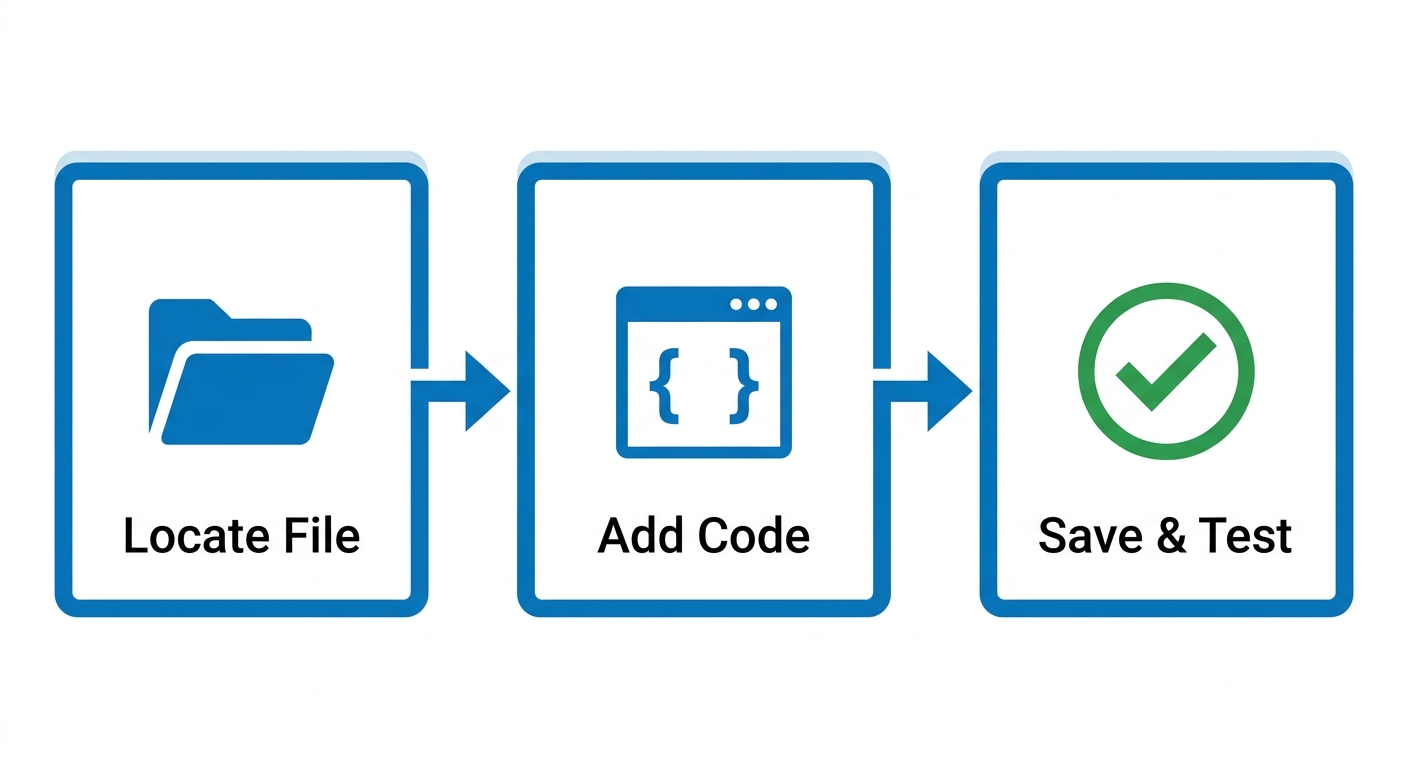
Enable WordPress debug mode in three simple steps
We recommend disabling debug mode on any public site, as the WordPress.org developer handbook advises; an active WP_DEBUG can expose sensitive data and slow performance. Routine debugging uncovers PHP warnings that erode site stability, a factor that indirectly influences local SEO. If your team needs deeper site diagnostics, explore our full white label SEO packages. Once you’ve enabled debug mode, learn how to interpret the logs in the next section.
Enabling Debug Logging to Capture Errors
To capture these errors for analysis, you need to enable WordPress debug mode through the platform’s built-in debugging constants. Before making changes, you can check whether WordPress debug mode is already active by inspecting your wp-config.php file. According to the official WordPress.org documentation, configuration starts in the site’s main configuration file.
- Use FTP or your hosting file manager to open wp-config.php, located in the root directory of your WordPress installation.
- Before the line that reads
/* That’s all, stop editing! Happy blogging. */, insert the following constants:
define( 'WP_DEBUG', true );
define( 'WP_DEBUG_LOG', true );
define( 'WP_DEBUG_DISPLAY', false );- Save the file and ensure the /wp-content/ directory is writable so the server can create the debug.log.
- After triggering the error again, access /wp-content/debug.log via FTP to view the captured errors.
The WP_DEBUG constant activates the built-in error reporting; WP_DEBUG_LOG writes errors to /wp-content/debug.log; and setting WP_DEBUG_DISPLAY to false prevents error messages from appearing on your live site—keeping visitors’ experience clean while you diagnose.
Never leave debug mode enabled on a production site: it can leak sensitive path and database details. Always revert the constants to false once troubleshooting is complete. If debugging or deeper technical work feels complex, a local SEO expert in Miami can help you identify and resolve WordPress issues efficiently.
With debug logging active, you can now review the debug.log file to identify specific errors.
Controlling Error Display with WP_DEBUG_DISPLAY
Building on the general debug mode introduced earlier, we now focus on controlling error visibility with the WP_DEBUG_DISPLAY constant. Within WordPress debug mode, WP_DEBUG_DISPLAY is a boolean configuration that dictates whether PHP errors, warnings, and notices appear directly within the site’s HTML output. It only takes effect when the master switch WP_DEBUG is set to true; if WP_DEBUG is false, WP_DEBUG_DISPLAY is ignored completely.
The official WordPress developer documentation states that when WP_DEBUG_DISPLAY is not explicitly defined, it defaults to true whenever WP_DEBUG is true. For any live or staging site, we strongly recommend setting WP_DEBUG_DISPLAY to false—exposing raw error messages to visitors can leak sensitive file paths and configuration details. Only keep it true on local development installations where you can safely inspect errors. When setting up your debug mode configuration, it’s critical to keep logging separate from visible error output.
To suppress on-screen errors while still recording them for debugging, add the following line to your wp-config.php file, placing it before the /* That’s all, stop editing! */ comment:
define('WP_DEBUG_DISPLAY', false);Be careful to use the boolean false without quotes; writing ‘false’ would be interpreted as a truthy value by PHP. Always create a backup of wp-config.php before editing. With on-screen display disabled, you can later capture errors silently using WP_DEBUG_LOG, which we’ll examine next.
Disabling Debug Mode After Troubleshooting
Once your debugging is complete, it is critical that we disable WordPress debug mode to protect your site’s security and performance. Leaving debug mode active exposes sensitive error details to visitors and increases server load. According to the official WordPress documentation, the following steps will safely disable debugging:
- Open the
wp-config.phpfile using FTP or your hosting control panel. - Locate the lines that define
WP_DEBUG,WP_DEBUG_LOG, andWP_DEBUG_DISPLAY. Either comment them out or set each tofalse:
define('WP_DEBUG', false);
define('WP_DEBUG_LOG', false);
define('WP_DEBUG_DISPLAY', false);- Save the file and refresh your site’s front end to verify no debug notices appear.
- Optionally, check the browser’s console and page source for any remaining debug output.
After disabling debug mode, we suggest proceeding to clear any remaining error logs and run a final performance check. We strongly caution against relying on WordPress debugging features as a permanent logging solution; dedicated monitoring tools are the proper approach.
Interpreting Common Debug Log Entries
When WordPress debug mode is enabled, it logs PHP errors that reveal underlying site issues. Interpreting these entries helps us maintain site reliability and SEO health.
A PHP Notice: Undefined variable (e.g., “PHP Notice: Undefined variable: _POST in /wp-content/themes/theme/functions.php on line 45”) indicates a variable used without prior definition. While minor, it can affect code quality. A PHP Warning: Missing include (e.g., “PHP Warning: include(): Failed opening ‘missing-file.php'”) means a required file couldn’t load, potentially breaking partial functionality. A PHP Fatal Error: Out of memory (e.g., “PHP Fatal error: Allowed memory size exhausted”) stops script execution and often stems from memory-intensive plugins. In each case, the file path and line number are crucial for locating the source. Database errors like “WordPress database error Table not found” commonly point to plugin or theme conflicts.
According to the official WordPress documentation, debugging tools are intended for development and staging environments. We strongly advise disabling debug mode on production sites once finished—logs can expose sensitive data. Armed with these interpretation tips, you can now move on to resolving the most common errors.
Identifying Plugin Conflicts with Debug Mode
Beyond enabling debug mode, its real power in WordPress debug mode lies in pinpointing plugin conflicts that cause site errors. We recommend adding the lines define( 'WP_DEBUG', true ); and define( 'WP_DEBUG_LOG', true ); to your wp-config.php file, as outlined by WordPress.org. This creates a debug.log file in /wp-content/ directory. Before testing, clear the log to avoid old entries. Temporarily deactivate all plugins and reactivate them individually while checking the debug.log after each activation. On live sites, set WP_DEBUG_DISPLAY to false to avoid exposing errors. Once troubleshooting is complete, disable debug mode to prevent performance overhead.
In the debug.log, look for PHP fatal errors or deprecated notices that reference a plugin’s function name. WordPress debug mode reveals these errors directly in the log, helping you identify the problematic function. Systematic deactivation confirms the culprit, though results may vary. Once you have identified the conflicting plugin, the next step is resolving the issue – covered in the following section.
Fixing PHP Errors Found During Debugging
Once PHP errors are uncovered by enabling WordPress debug mode, we must resolve them systematically. Each error message includes a file path and line number—for example, wp-content/themes/our-theme/functions.php:42—so we can immediately locate the problematic code.
The three most common error categories and their fixes include:
- Deprecated function calls: Replace older functions with current WordPress alternatives, consulting the official WordPress Developer Reference for the latest function signatures and replacement suggestions.
- Fatal syntax errors: Usually introduced by recent plugin updates or theme changes. Revert the updated file or correct the syntax using a staging environment.
- Undefined variable warnings: Initialize all variables before use. This practice, recommended by WordPress.org, prevents unexpected behavior.
Always test all fixes on a staging site or use a plugin like WP Rollback to safely revert updates. Avoid relying on server-level error suppression, which merely hides the symptoms rather than addressing the root cause. Once every error is corrected and verified, we disable WP_DEBUG and WP_DEBUG_DISPLAY in our production configuration. This protects visitors from seeing error details and improves site security.
Troubleshooting Debug Mode Issues
Once you have enabled WP_DEBUG as described above, you may encounter messages that need interpretation. When WordPress debug mode is enabled, it exposes underlying PHP warnings, notices, and deprecated function calls that help diagnose site issues without immediately affecting the user experience.
A Notice such as “Undefined index” means code is referencing a variable that hasn’t been set, while a Warning like “Cannot modify header information” often results from output being sent before WordPress can set headers. A Deprecated notice, for example “Function create_function() is deprecated,” signals that a plugin or theme is using outdated PHP functions slated for removal. According to WordPress documentation, these messages are non-fatal but should be addressed to maintain code quality and compatibility.
To isolate the source, we recommend deactivating all other plugins except SEOLocal and switching to a default WordPress theme such as Twenty Twenty-Four. If the debug messages disappear, the conflict lies with a deactivated component. Enabling WP_DEBUG_LOG writes errors to the /wp-content/debug.log file for analysis without displaying them on screen. Our SEOLocal plugin adheres to WordPress coding standards, so any debug notices originating from it are unlikely; however, outdated themes or other plugins may interact in unexpected ways. Note that the plugin’s normal operation—including admin account creation and remote server connection—should not trigger critical errors. This troubleshooting process may help identify the source of the issue.
After you’ve resolved the underlying problem, it is essential to disable debug mode on your production site. Leaving WP_DEBUG true on a live site can expose sensitive information and slow performance. Follow the steps in the next section to safely turn off debug mode.
Maintaining a Healthy, Error-Free WordPress Site
Regular WordPress core, theme, and plugin updates are essential for security and stability. When issues arise, understanding how to use WordPress debug mode helps catch errors early before they impact visitors. A well-maintained site lays the foundation for all further SEO work.
To enable WordPress debug mode, add define( 'WP_DEBUG', true ); to wp-config.php and ensure the debug.log file is accessible. We also advise scheduling automated backups and using security plugins like Wordfence to prevent data loss and malicious access. According to the official WordPress documentation, these debugging tools are best used on staging environments to avoid exposing error details to live visitors. This proactive approach identifies code conflicts and performance bottlenecks before they become larger problems.
Our plugin installation and WordPress support services handle these technical details for you, freeing you from manual debugging and maintenance. We help reduce errors and keep your site stable, though no site can be guaranteed 100% error-free—results vary. With a stable site in place, we can focus on advanced SEO strategies that drive Fast SEO Results!