- Advanced Local SEO Strategies
- Fundamentals of Local SEO
- Google Business Profile (GBP) Optimization
- Local Keywords and Content Strategy
- Local Link Building
- Local Paid Advertising
- Local Search Ranking Factors
- Local SEO Best Practices
- Local SEO Tools and Analytics
- Local Social Media Marketing
- Online Reviews and Reputation Management
- Technical SEO for Local Businesses

Local SEO Heat Mapping Tools: How They Work

Your business might be invisible to 72% of nearby customers searching for services like yours on Google Maps right now. Geographic visibility gaps cost companies thousands in lost opportunities monthly, yet most never realize where they’re falling short.
Specialized platforms solve this by analyzing your Google Business Profile performance across neighborhoods, cities, or states. They transform raw ranking data into color-coded visuals, instantly showing where you dominate search results – and where competitors outrank you.
These reports reveal patterns that text-based analytics can’t capture. Bright red zones might indicate areas where your content lacks location-specific keywords, while green hotspots confirm successful optimization efforts. The best solutions update these maps daily, letting you track improvements as they happen.
Key Takeaways
- Visual reports simplify complex ranking data across service areas
- Color-coded maps highlight strong and weak geographic performance
- Real-time updates help refine Google Business Profile strategies
- Identifies competitor strengths in specific locations
- Supports data-driven decisions for neighborhood-level optimization
Introduction to Local SEO Heat Mapping Tools
Understanding where your company appears in neighborhood search results determines success in attracting nearby customers. Specialized software solutions help visualize these patterns through color-coded maps, revealing hidden opportunities across your service areas.
Evaluating Solutions Systematically
Our analysis compares 12 platforms using real-world testing scenarios. We prioritize features that show immediate impact on visibility improvements. Key factors include update frequency, customization options, and integration with other marketing systems.
| Feature | Description | Importance |
|---|---|---|
| Data Accuracy | Real-time position tracking | Critical for strategy adjustments |
| Usability | Intuitive dashboard navigation | Saves training time |
| Reporting | Customizable export formats | Supports team collaboration |
| Market Coverage | Multi-city tracking capacity | Essential for regional chains |
Why US Companies Need This Technology
American markets show dramatic variations in consumer search habits. Urban areas demand different tactics than suburban regions. Platforms that account for these differences help companies allocate resources effectively.
Dense commercial zones require precise tracking of competitor movements. Rural markets benefit from identifying underserved locations. The right software adapts to these challenges while maintaining consistent performance metrics.
Understanding Local SEO and Its Impact on Your Business
Three out of five consumers click on the first results they see for nearby services. This behavior makes your digital presence in geographic searches critical for attracting customers. Companies that optimize for location-based queries see 2.3x more engagement than those relying on generic strategies.
Why the Google Map Pack Matters
The Map Pack displays three businesses at the top of search results. These spots capture 44% of all clicks for local queries. Your chances of appearing here depend on how well your business profile matches what customers need.
Google prioritizes complete profiles with accurate hours, photos, and services listed. Regular updates and customer reviews also boost your ranking. Missing information can push you below competitors in the results.
Connecting Through Location Searches
People searching “near me” want immediate solutions. Your profile’s content determines whether you appear for these queries. Use phrases like “plumber in [city]” or “dentist near downtown” to align with common searches.
| Ranking Factor | Description | Optimization Tip |
|---|---|---|
| Relevance | Matches search intent | Use location-specific keywords |
| Proximity | Distance from searcher | List service areas accurately |
| Prominence | Online reputation | Encourage customer reviews |
| Profile Quality | Completeness of details | Update hours/services weekly |
Businesses appearing in the Map Pack gain 38% more website visits on average. This visibility builds trust, as customers perceive top-ranked companies as more reliable. Consistent optimization helps maintain this advantage over time.
What Are Local SEO Heat Mapping Tools?
Businesses often lack clarity about their visibility across neighborhoods where customers search. Specialized platforms address this by converting raw geographic data into actionable insights. These systems reveal where your brand appears in search results and how rankings shift between locations.
Definition and Key Concepts
Geogrid reports track your Google Business Profile performance through color-coded maps. Red zones show areas where competitors outrank you, while green indicates strong visibility. This approach differs from standard reports by focusing on precise geographic patterns.
Here’s how these platforms work:
- Simulate searches from multiple locations to mimic real user behavior
- Measure ranking positions for targeted keywords in each area
- Display results through intuitive visual formats for quick analysis
The technology accounts for how proximity affects search results. A café might rank #1 in its immediate neighborhood but disappear two miles away. These variations highlight where profile optimizations deliver the most impact.
Key advantages include identifying underserved markets and tracking progress after strategy changes. Unlike text-based analytics, visual maps make complex data instantly understandable. This helps prioritize efforts where improvements matter most.
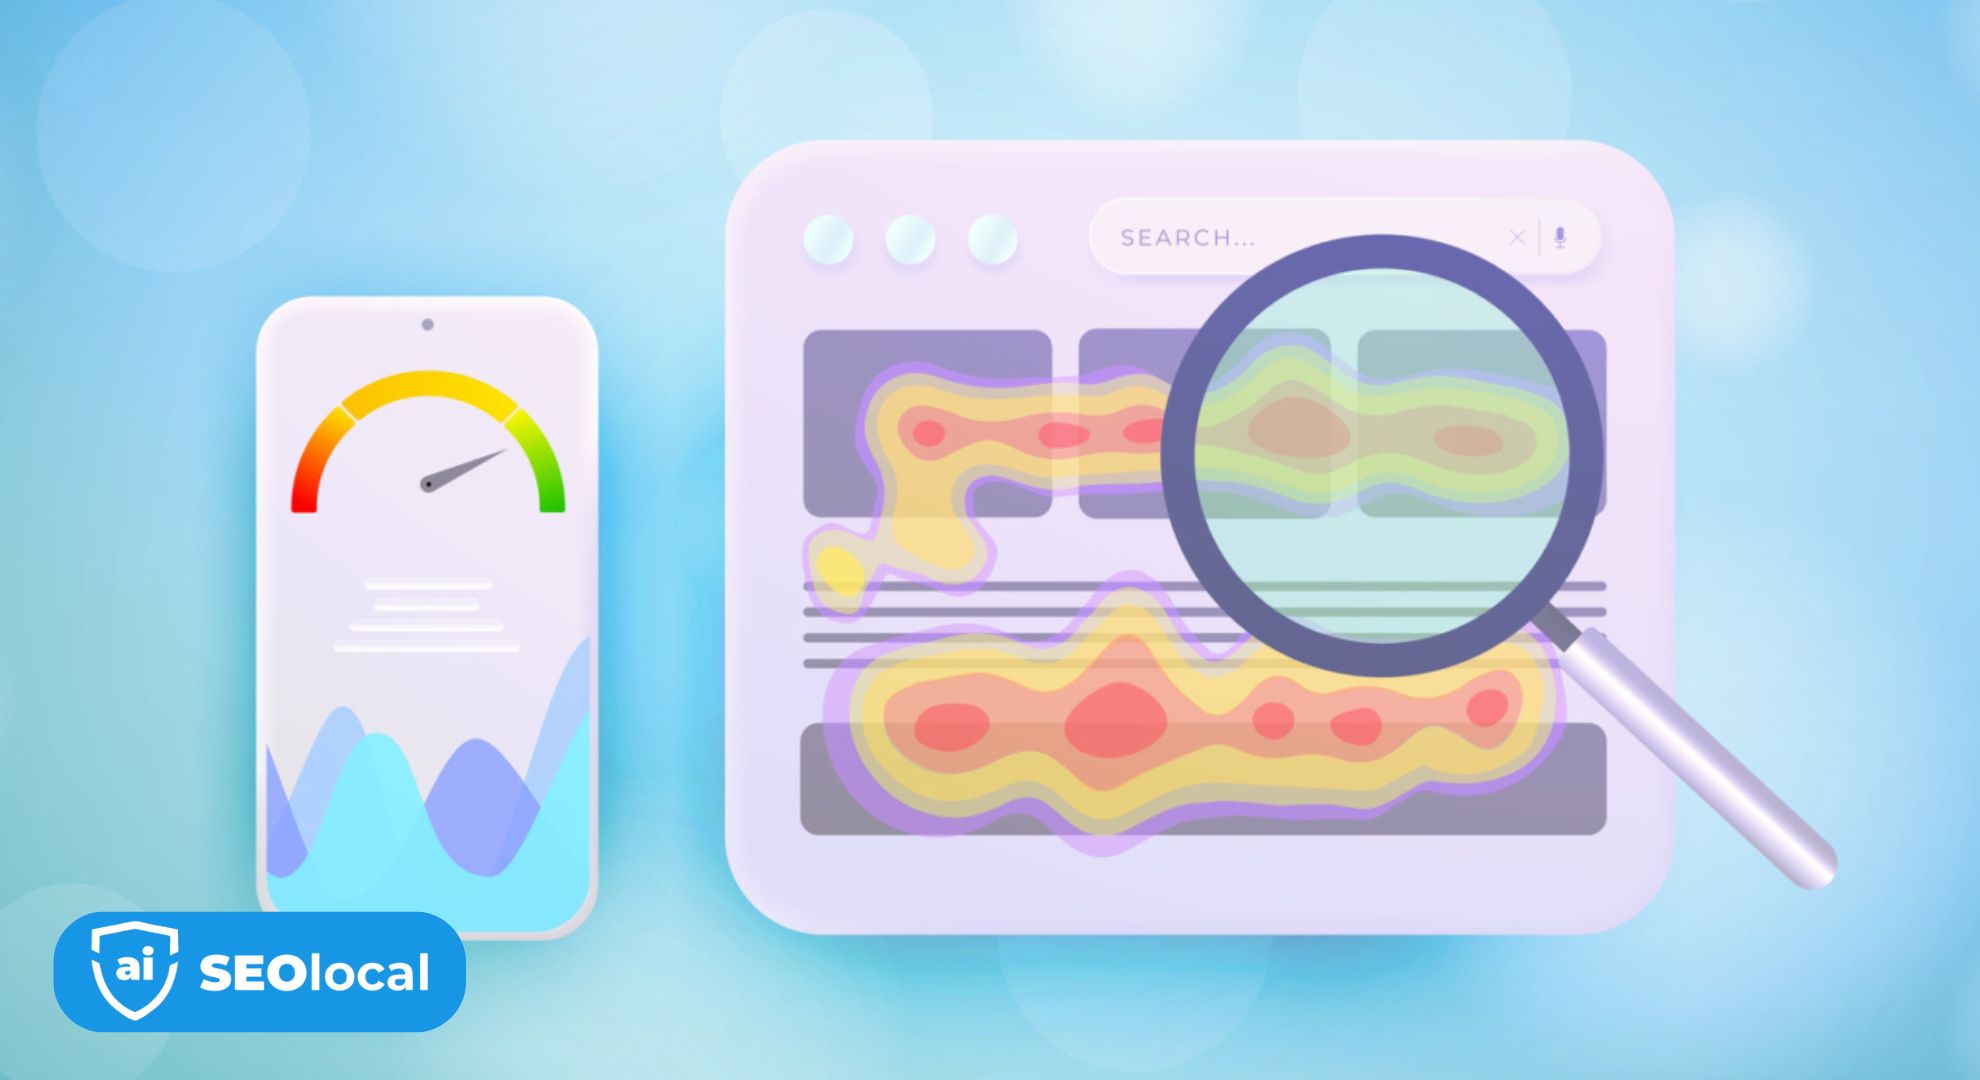
How Heat Mapping Visualizes Google Business Metrics
Visual reports transform complex ranking patterns into clear action steps. These tools display your performance across neighborhoods using color gradients that instantly communicate strengths and weaknesses. You’ll see exactly where customers find you easily – and where your visibility drops.
Interpreting Geogrid and Heatmap Reports
Color coding simplifies analysis. Deep green zones show where your profile appears in top search results. Red areas indicate locations needing immediate attention. These patterns help prioritize updates to your google business information.
Grid systems break service areas into precise sections. Each square represents 0.1-5 miles, matching how people search locally. Darker red in a specific block? Competitors likely dominate there. Consistent green across multiple blocks confirms effective optimization.
Scale matters. Reports tracking 20-minute commute zones align with real user behavior. Narrow grids reveal hyperlocal gaps, while wider views show regional trends. This helps tailor strategies for urban versus suburban markets.
Historical comparisons uncover progress. Updated maps let you track ranking changes after adjusting your profile. Overlay customer density data to see where visibility improvements drive actual results.
Use these reports to spot hidden opportunities. A cluster of orange blocks might mean adding neighborhood-specific keywords. Sudden red zones could signal new competitors – time to boost reviews or service details.
Key Features to Look For in a Heat Mapping Tool
Choosing the right platform to analyze geographic search performance requires understanding critical features that drive actionable insights. Professional systems go beyond basic metrics to reveal patterns influencing customer discovery.
Essential Tool Capabilities and Functionalities
Top platforms combine real-time data with historical comparisons. Look for systems updating rankings hourly and storing at least six months of trends. This helps spot seasonal changes or algorithm impacts.
Precision matters. Adjustable grid sizes let you focus on specific neighborhoods or entire regions. Some tools track competitors’ visibility down to street-level accuracy. Integration with review management and citation platforms saves time when making profile updates.
Importance of Visual Reporting and Rank Tracking
Color-coded maps simplify complex data. Green zones show strong performance, while red areas highlight urgent needs. These visuals help teams quickly grasp priorities without technical training.
Exportable reports make collaboration easier. Share progress with stakeholders using PDF or spreadsheet formats. Automated alerts notify you of sudden ranking drops, enabling faster responses to market changes.
Always verify data sources. Reliable tools use verified search simulations rather than estimates. Combine this with competitor benchmarking to identify underserved areas where you can dominate searches.
Roundup of Top Local SEO heat mapping tools
Selecting the right platform to analyze geographic search data can transform how you identify market opportunities. Established solutions and newer entrants offer distinct approaches to tracking performance across neighborhoods.

Geogrid Precision and Customization
Leading platforms differ in how they display location-based performance. Some provide street-level tracking through adjustable grids, while others focus on broader regional patterns. LocalFalcon stands out with dynamic radius controls, letting you analyze 1-50 mile ranges.
Specialized features separate advanced tools from basic options:
- Multi-location tracking for businesses serving multiple cities
- Historical comparisons showing ranking changes over weeks/months
- Competitor overlay modes revealing rival strengths
Reporting Depth and Actionability
Data presentation quality determines how quickly you can act on insights. BrightLocal combines heatmaps with review monitoring, while Merchynt’s free audit highlights urgent visibility gaps. Consider these factors when evaluating outputs:
| Platform | Key Strength | Best For |
|---|---|---|
| LocalViking | Q&A post integration | Customer engagement |
| Track Right | Algorithm change alerts | Technical teams |
| Local Grids | Mobile-optimized views | Field service teams |
Newer entrants often innovate faster – Local Grids offers real-time traffic overlays, while Track Right prioritizes Google updates tracking. Match these capabilities to your business profile management needs and team workflow.
Deep Dive: Merchynt’s Free Local SEO Rank Audit Tool
Many businesses hesitate to explore geographic performance analysis due to cost barriers. Merchynt addresses this challenge with a credit-based system that delivers actionable insights without monthly fees. Their approach lets you test core features before scaling your investment.
Strategic Advantages of Accessible Technology
The platform provides five complimentary keyword checks each month. This model helps companies evaluate visibility gaps across neighborhoods without financial commitments. Unlike subscription services, purchased credits remain available indefinitely – ideal for businesses with seasonal audit needs.
Focus on Google Business Profile optimization sets this solution apart. Reports highlight missing profile elements impacting local discovery. You might discover inconsistent service area definitions or incomplete category selections dragging down specific locations.
Credit System Flexibility
Additional report packages adapt to various usage patterns. Consultants handling multiple clients can buy bulk credits, while single-location businesses use occasional audits. This structure prevents paying for unused features common in all-in-one platforms.
The tool integrates with broader profile enhancement services. After identifying weak zones through color-coded maps, you can directly implement recommended optimizations. This connection between analysis and action creates streamlined workflow efficiencies.
Merchynt’s specialization in Google’s systems ensures precise tracking of ranking factors that matter most. Their reports filter out vanity metrics, focusing instead on changes that directly improve neighborhood visibility. This targeted approach helps prioritize high-impact adjustments.
Exploring Additional Tools in the Market
The landscape of geographic visibility tools continues to evolve as providers expand their offerings beyond basic tracking. Established players and new entrants now deliver diverse approaches to analyzing search performance across neighborhoods.
Comparing Core Capabilities
LocalViking stands out with over seven years refining its platform. It combines grid-based visibility reports with direct profile management features. Users can respond to reviews and update Q&A sections without switching platforms.
BrightLocal shifted focus from citation management to visual performance tracking. Its tools emphasize how directory listings influence neighborhood search rankings. This integration helps businesses maintain consistent information across platforms.
| Tool | Key Features | Best Use Case |
|---|---|---|
| LocalViking | Review responses, historical data | Multi-location operations |
| BrightLocal | Citation audits, custom grids | Brand consistency checks |
| Local Grids | Mobile-first interface | Field service teams |
| Track Right | Algorithm change alerts | Technical SEO focus |
Newer options like Local Grids prioritize mobile-friendly dashboards for teams on the move. Track Right caters to technical users needing real-time Google algorithm updates. These emerging tools often target specific niches larger platforms overlook.
Your choice depends on whether you need comprehensive services or specialized functionality. Established providers offer reliability, while newer platforms frequently introduce innovative features. Consider how each tool aligns with your team’s workflow and market coverage needs.
Integrating Geogrid and Heatmap Data with Overall SEO Strategy
Combining geographic insights with your existing efforts creates a multiplier effect. Visual performance tracking helps prioritize actions that deliver measurable improvements where they matter most. This approach turns raw numbers into clear roadmaps for growth.
Turning Insights Into Action
Start by aligning color-coded maps with your content calendar. Areas showing weak visibility might need neighborhood-specific landing pages. Strong zones reveal which keywords and services resonate with local audiences.
Compare your rankings against nearby competitors in problem areas. If they rank higher for “emergency plumbing” in specific blocks, update your service descriptions and photos to match those needs. Track changes weekly to measure impact.
Merge geographic data with website analytics. High traffic from regions where you rank poorly suggests untapped potential. Adjust your strategy to capture these missed opportunities through targeted optimizations.
Consistent analysis helps you stay ahead. Regular updates to your business profile, combined with visual tracking, create a feedback loop for continuous improvement. This method proves more reliable than chasing volatile search trends alone.
FAQ
How do heat mapping tools improve visibility in the Google Map Pack?
These tools analyze your business profile’s performance across specific areas, showing where you rank compared to competitors. Visualizing data through geogrids helps identify gaps in coverage, letting you adjust strategies to boost local search rankings.
What metrics should you prioritize when choosing a heat mapping service?
Look for rank tracking accuracy, competitor comparison features, and visual reporting. Tools like BrightLocal or LocalViking offer layered maps to highlight your visibility in target cities, helping you focus on high-impact zones.
Can free tools like Merchynt’s audit service compete with paid options?
Merchynt’s free keyword audit provides actionable insights for Google Business Profile optimization, including citation management and review tracking. While paid platforms offer deeper reporting, their tool is ideal for businesses starting with limited budgets.
How does geogrid data help outperform nearby competitors?
Geogrid reports break down rankings by neighborhood or street, revealing where rivals dominate. By adjusting your profile’s keywords or service areas based on this data, you can capture more visibility in underserved locations.
Are heatmaps useful for multi-location businesses?
Yes. Platforms like LocalViking layer rankings across branches, showing regional strengths and weaknesses. This helps agencies manage clients with multiple profiles by tailoring strategies per location without overlapping efforts.
What role do reviews play in heat mapping analysis?
Reviews influence local search rankings and customer trust. Heat mapping tools often overlay review density with ranking performance, letting you prioritize reputation management in areas where ratings impact visibility the most.